Volume is arguably the most underutilized and misunderstood aspect of technical analysis in trading. While most traders focus exclusively on price movements, the true professionals understand that volume is the fuel that drives price action. Without significant volume, price movements lack conviction and are more likely to reverse. In this comprehensive analysis, I'll reveal how volume analysis can transform your trading approach and help you identify high-probability setups that most retail traders completely miss.
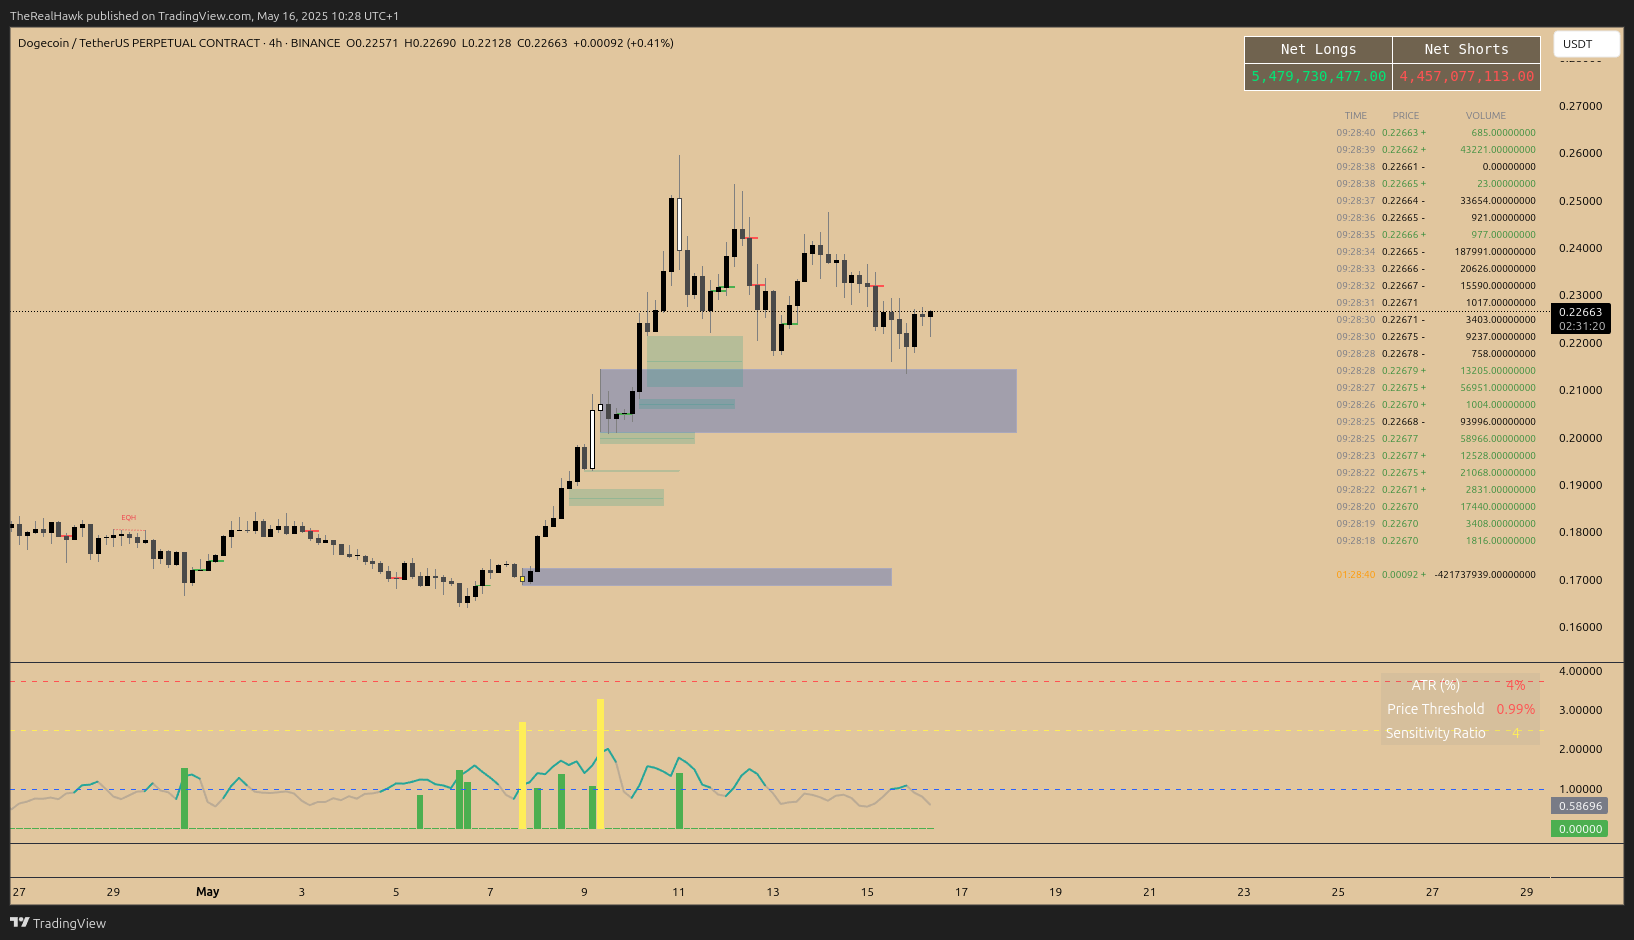
Having achieved a 90% account gain last year using these exact techniques, I've seen firsthand how proper volume analysis can be the difference between consistent profitability and frustrating losses. The chart above demonstrates a perfect example of how volume anomalies preceded a significant price movement in Dogecoin, providing early signals that most traders overlooked.
Why Most Traders Fail to Use Volume Effectively
The majority of retail traders make a critical mistake when analyzing charts: they focus almost exclusively on price action while treating volume as an afterthought. This approach is fundamentally flawed because price movements without corresponding volume confirmation are inherently suspect. Think of volume as the "truth detector" for price action – it reveals the genuine conviction behind market movements.
Common volume analysis mistakes I regularly observe include:
First, traders often fail to recognize divergences between price and volume. When price makes a new high but volume fails to confirm with increasing participation, this signals potential weakness in the trend. Conversely, when price makes a new low but volume decreases, this can indicate diminishing selling pressure and a potential reversal.
Second, many traders don't understand the significance of volume spikes. Abnormal volume often precedes major price movements and can signal institutional involvement. These volume anomalies are essentially footprints left by smart money before significant moves occur.
Third, traders frequently overlook the importance of relative volume. It's not just about whether volume is high or low in absolute terms, but how it compares to recent average volume. A 50% increase in volume relative to the 20-day average tells a much more compelling story than looking at the raw numbers alone.
Finally, most retail traders fail to integrate volume analysis with price action and other indicators. Volume should never be analyzed in isolation but rather as part of a comprehensive trading approach that includes support/resistance levels, trend analysis, and momentum indicators.
Reading the Tape: The Lost Art of Volume Interpretation
"Reading the tape" is a skill that originated with the old ticker tape machines but remains incredibly relevant in today's digital trading environment. It refers to the practice of analyzing the flow of transactions to gain insight into market sentiment and potential price direction. While modern traders don't literally read ticker tape, the principle of closely examining transaction data remains powerful.
At its core, reading the tape involves observing the speed, size, and sequence of trades to identify potential buying or selling pressure. When large buy orders are being filled with minimal price impact, it suggests strong support. Conversely, when small sell orders drive prices down significantly, it indicates weak buying interest and potential further downside.
The chart above demonstrates how volume behavior at key price levels can reveal important market dynamics. Notice how the price consolidated in a tight range while volume gradually decreased, followed by a sudden volume spike that preceded the breakout move. This pattern is a classic example of accumulation followed by markup – a sequence that repeats across all timeframes and markets.
One particularly powerful technique is monitoring volume at key technical levels. When price approaches a significant support or resistance level, volume behavior often reveals whether that level will hold or break. Increasing volume on tests of support suggests accumulation and potential reversal, while decreasing volume on repeated tests suggests eventual breakdown.
Another aspect of reading the tape is identifying "absorption" – when large amounts of buying or selling are being absorbed without significant price movement. This often indicates that smart money is taking the other side of the trade, potentially leading to a reversal once the order flow exhausts.
Volume Anomalies: The Key to Understanding Supply and Demand
Volume anomalies are unusual patterns in trading volume that often precede significant price movements. These anomalies are essentially windows into institutional activity – the footprints left by smart money before major moves occur. Learning to identify and interpret these patterns can give you a tremendous edge in anticipating market direction.
The most significant volume anomalies include:
Volume climax events, which occur when trading volume spikes dramatically, often 200-300% above average, signaling potential exhaustion of buying or selling pressure. These events frequently mark short-term tops or bottoms and can be excellent contrarian indicators. The chart above shows a perfect example of a volume climax that preceded a significant trend change.
Declining volume during consolidation phases, which suggests a decrease in selling pressure and potential accumulation by smart money. When price consolidates in a tight range while volume gradually decreases, it often indicates that sellers are becoming exhausted and a breakout may be imminent.
Volume confirmation or non-confirmation of breakouts is another critical anomaly. True breakouts should be accompanied by a significant increase in volume, ideally 50% or more above average. Breakouts that occur on average or below-average volume have a much higher failure rate and often lead to false breakout scenarios.
Perhaps most importantly, volume often leads price. Increasing volume before price movement suggests building pressure that will eventually result in a significant move. By identifying these early volume signals, you can position yourself ahead of the crowd rather than chasing moves after they've already begun.
The chart above demonstrates how volume behavior at key price levels revealed important supply and demand dynamics. Notice how the price consolidated in a tight range while volume gradually decreased, followed by a sudden volume spike that preceded the breakout move. This pattern is a classic example of accumulation followed by markup – a sequence that repeats across all timeframes and markets.
Practical Volume Analysis Techniques for Everyday Trading
Now that we understand the importance of volume and how to identify key anomalies, let's explore practical techniques you can apply in your daily trading:
First, always compare current volume to recent average volume. I typically use a 20-day moving average of volume as my baseline. Volume that exceeds this average by 50% or more deserves special attention, as it often indicates significant institutional involvement.
Second, pay close attention to volume on retests of support and resistance. Decreasing volume on retests of resistance suggests weakening selling pressure and increased likelihood of a breakout. Conversely, decreasing volume on retests of support suggests weakening buying interest and increased likelihood of a breakdown.
Third, use volume profile analysis to identify key price levels where significant trading has occurred. These high-volume nodes often act as support and resistance in future price action. The volume profile essentially reveals where smart money has been most active and where they're likely to defend their positions.
Fourth, monitor relative volume at different times of the day. The first and last hours of trading typically have the highest volume and provide the most reliable signals. Unusual volume spikes during typically quiet periods (like mid-day) deserve special attention as they often indicate important institutional activity.
Finally, integrate volume analysis with other technical indicators. Volume trends should confirm what you're seeing in momentum indicators like RSI or MACD. Divergences between volume and these indicators often provide powerful trading signals that can help you stay ahead of major market moves.
Key Takeaways
- Volume is the fuel that drives price action – without significant volume, price movements lack conviction
- Reading the tape involves analyzing transaction flow to gain insight into market sentiment and direction
- Volume anomalies often precede significant price movements and reveal institutional activity
- Volume should be analyzed relative to recent average volume, not just in absolute terms
- Integrating volume analysis with price action and other indicators creates a comprehensive trading approach
Ready to Improve Your Trading?
Apply these strategies with the help of my Profit Sniper indicator and take your trading to the next level.
